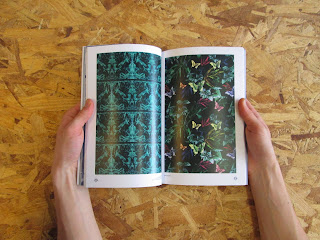
Brief:
Design a publication which communicates my research process through examining a methodology i have applied in a recent brief (informative waste). Divide the methodology into sections to allow an outside reader to get a clearer view into how my mind functions, and the processes i go through to reach my final outcomes for work. Be sure to communicate the different levels of analysis and repeating which go into my data collection. |
Background:
The informative waste brief was very data heavy, and represents the culmination of my experience in communicating statistically lead briefs. The concepts discussed with Ben from Ditto Press will be very useful here, as the breaking down of a methodology into its sontituent parts represents a deeper understanding of the overall flow of information. |
Considerations:
How can this publication represent me personally, while at the same time sticking to the content and communicating clearly the information. Consider the use of type as diagrams, as this allows for a uniform feel while at the same time processing a large amount of information. |
Mandatory Requirements:
Printed and bound publication which investigates a methodoly for researching and understanding a subject better. |
Target Audience:
Module adjudicators, but more broadly anyone who might read it. The challenge for me with this brief is to create a publication that anyone could read and understand. |
Tone of Voice:
Professional
and yet informal. As this is a personal guide, overly professional lexis and design decisions can be bent towards a more approachable tone. |
Deliverables:
Printed and bound design publication.Boards. |
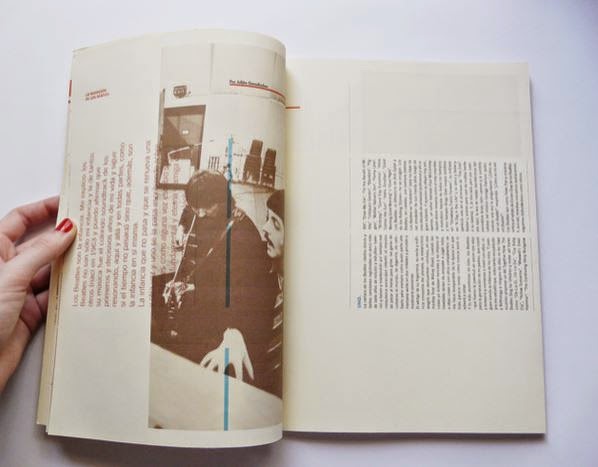
As this publication will be quite simple, I would like to use a ring bound methods for securing the pages. Perhaps something like image below however not with conventional single ring set, but rather with singular rings, allowing the publication to have a looser feel.
a wraparound style cover may be emplyedm, as seen above.
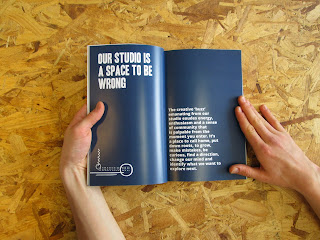
different coloured stock will also be employed, as much of the content will be data based.
colours will be selected to allow monotone images to function well and remain consistent despite different colours.
for how the content is communicated, I seek to use simply imagery, largely text based, as this quickly gets the message across.
while i like the hand rendered style exhibited here, i think the clean cut digital style will function better with the stock and binding method i am using. particularly as the type is all digitally set.
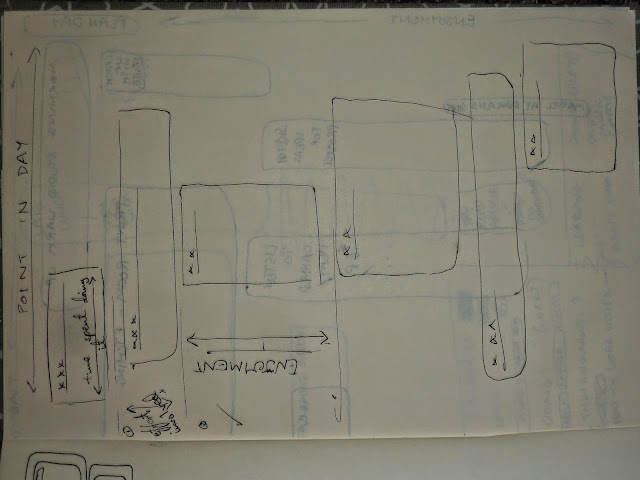
some planning:
research which informeed my design publication:
Styrofoam Vs. Plastic - use cups
- toxicity
- cost
- recyclability
- avg. use time
Paints - spread paint around
- toxicity
- by colour
- harmful attributes
- avg. distance travelled
MDF - use circles
- recyclability
- energy used to make (m2)
- cost to make (m2)
- decomposing time?
Cardboard - use boxes
- price (m2)
- trees (m2)
- how much is recycled (% or tonnes UK)
Milk cartons
Paper (pre use) - folded
- % recycled
- % FSC certified
- % unsustainable
- avg. distance transported
paper (post use) - crunched up
- % that gets recycled (or tonnes)
- % landfilled (or tonnes)
(same as paper for wood?)
Rubber - tubes
- avg. transportation
- avg. cost/kg
- deforestation stats
use CDs for pie chart(s) about tech stats?
Vacuform -
- energy used to make
- decomposing time
- % used in UK packaging
general UK packaging - metal, glass, plastic, styrofoam, cardboard
- % of total of each material use
- % of each material used which is recycled
Do matches?
------
use percentages comparisons between producing from virgin and producing from recycled?
Definite objects so far:
(stats uk only)
Paper
before:
£5,565,000,000 of paper/paperboard imported 2012 - p47 of http://www.ons.gov.uk/ons/dcp171778_300994.pdf
energy for manufacturing 1 tonne office paper requires 37.01 million Btu for virgin and 20.12 million Btu for recycled - p26/28 of http://www.epa.gov/climatechange/wycd/waste/downloads/chapter2.pdf
therefore 83.9% more energy used for virgin
paper production breakdown (into percentages) and total tonnage - p10 of http://www.forestry.gov.uk/pdf/ukwpt13.pdf/$FILE/ukwpt13.pdf
recycled newspaper production 0.34 mtce, virgin 0.58 mtce per tonne (from epa - link above)
therefore
12.5 million tones paper used annually uk
v
after:
recycling 1 tonne paper saves 1.32 tonnes carbon equivalent- p2 of http://www.paper.org.uk/information/factsheets/greenhouse_gas.pdf
520,000 tonnes paper went to landfill in 2012 uk - https://www.gov.uk/government/uploads/system/uploads/attachment_data/file/416471/UK_Statistical_release_UPDATEv6_19_03_2015.pdf
paper packaging accounted for 36% of all UK waste 2012 p23 of https://www.gov.uk/government/uploads/system/uploads/attachment_data/file/422618/Digest_of_waste_England_-_finalv2.pdf
It takes 7 days for a recycled newspaper to come back as a newspaper again. (recyclenow)
plastic bottle (PET) :
before:
£7,089,000,000 of plastic imported to uk 2012 - p47 of http://www.ons.gov.uk/ons/dcp171778_300994.pdf
manufacturing 1 tonne virgin PET produces 0.59 MTCE (metric tonnes carbon equivalent) - p24 of http://www.epa.gov/climatechange/wycd/waste/downloads/chapter2.pdf
manufacturing 1 tonne recycled PET produces 0.05 MTCE (metric tonnes carbon equivalent) - p24 of http://www.epa.gov/climatechange/wycd/waste/downloads/chapter2.pdf
energy for manufacturing 1 tonne PET requires 32.82 million Btu for virgin and 4.17 million Btu for recycled - p26/28 of http://www.epa.gov/climatechange/wycd/waste/downloads/chapter2.pdf
recycled pet produces 8.5% of carbon equivalent emissions produced by virgin production
virgin pet uses 586% more energy
global plastic production grew from 204 to 299 million tonnes between 2002 and 2013
http://issuu.com/plasticseuropeebook/docs/final_plastics_the_facts_2014_19122
after:
1,910,000 tonnes plastic packaging go to landfill (74.8% of total (2,554,000)) - p14 https://www.gov.uk/government/uploads/system/uploads/attachment_data/file/416471/UK_Statistical_release_UPDATEv6_19_03_2015.pdf
estimated that uk households use 500 plastic bottles per year
plastic remains for x years
cup (styro or plastic?) - apparently plastic cups usually code 7
before- £7,089,000,000 of plastic imported to uk 2012 - p47 of http://www.ons.gov.uk/ons/dcp171778_300994.pdf
after- 1,910,000 tonnes plastic packaging go to landfill (74.8% of total (2,554)) - p14 https://www.gov.uk/government/uploads/system/uploads/attachment_data/file/416471/UK_Statistical_release_UPDATEv6_19_03_2015.pdf
can (aluminium)
before:
manufacturing 1 tonne virgin aluminium produces 3.53 MTCE (metric tonnes carbon equivalent) - p24 of http://www.epa.gov/climatechange/wycd/waste/downloads/chapter2.pdf
manufacturing 1 tonne recycled aluminium produces 0.28 MTCE (metric tonnes carbon equivalent) - p24 of http://www.epa.gov/climatechange/wycd/waste/downloads/chapter2.pdf
energy for manufacturing 1 tonne aluminium requires 213.33 million Btu for virgin and 16.59 million Btu for recycled - p26/28 of http://www.epa.gov/climatechange/wycd/waste/downloads/chapter2.pdf
3.53/0.28 = 12.6
or 1261%
3.53-0.28 = 3.25
therefore 1161% more
16.59 as percentage of 213.33 = 7.8%
around 75% of all aluminium ever made is still in circulation - recyclenow.com
after-
100,000 tonnes aluminium packaging goes to landfill each year (61.5% of total (162,000)) - p14 https://www.gov.uk/government/uploads/system/uploads/attachment_data/file/416471/UK_Statistical_release_UPDATEv6_19_03_2015.pdf
aluminium can be recycled over and over with no loss of quality - http://www.aluminum.org/industries/production/recycling
glass bottle -
before:
2,173,803 tonnes container glass produced 2012 (estimate) - p85 http://www.wrap.org.uk/sites/files/wrap/GlassFlow%20Final%20Report.pdf
cost per tonne virgin green glass - £104.32 vs. cost per tonne recycled green glass - £83-£70 - p54 of http://www.wrap.org.uk/sites/files/wrap/GlassFlow%20Final%20Report.pdf
cost per tonne clear recycled - £86, whereas virgin is £106
2173805 x 106 = 230,423,330
2173805 x 86 = 186,947,230
former minus latter = £43,476,100 potential savings
manufacturing 1 tonne virgin glass produces 0.13 MTCE (metric tonnes carbon equivalent) - p24 of http://www.epa.gov/climatechange/wycd/waste/downloads/chapter2.pdf
manufacturing 1 tonne recycled glass produces 0.09 MTCE (metric tonnes carbon equivalent) - p24 of http://www.epa.gov/climatechange/wycd/waste/downloads/chapter2.pdf
after:
763,713 tonnes glass sent for remelt in 2012 -p34 of http://www.wrap.org.uk/sites/files/wrap/GlassFlow%20Final%20Report.pdf
870,000 tonnes glass sent landfill 2012 - p39 of http://www.wrap.org.uk/sites/files/wrap/GlassFlow%20Final%20Report.pdf NEEDS TO BE CHECKED
food (could do unused, avoidable and unavoidable?)-
before:
avg. uk household spends £56.8 on food and non-alcoholic drinks - http://www.theguardian.com/news/datablog/2013/dec/11/families-spend-489-each-week-on-what
after:
p8-9 of http://www.wrap.org.uk/sites/files/wrap/UK%20Estimates%20February%2015%20%28FINAL%29.pdf
food waste accounts for 16.8% (3.9 million tonnes) of all local authority collected waste 2010/11 - p34 of https://www.gov.uk/government/uploads/system/uploads/attachment_data/file/401400/Digest_of_waste_England_2015_-_final.pdf
food waste pie chart (use pie) -
do either food waste by sector or food waste by type of food use p38/p40 of https://www.gov.uk/government/uploads/system/uploads/attachment_data/file/422618/Digest_of_waste_England_-_finalv2.pdf
p38 -
(million tonnes)
household - 7
manufacturing - 3.92
hospitality 0.92
other - 3
retail wholesale - 0.45
15.29 total
so if 15.29 is 360
(360/15.29 = 23.54)
multiply each by above for degrees
household - 164.8
manufacturing - 92.3
hospitality- 21.7
other - 70.62
retail wholesale -10.6
TEST : 360.02 success
cumulative degrees :
not needed
clothes-
before:
3.25 million tonnes clothing flow through uk each year (= roughly 55 kg per person) - p2 of http://www.ifm.eng.cam.ac.uk/uploads/Resources/Other_Reports/UK_textiles.pdf
avg. uk household spends £23.4 on clothing and footwear - http://www.theguardian.com/news/datablog/2013/dec/11/families-spend-489-each-week-on-what
£14 trillion clothing imported 2012
after:
38% clothes waste incinerated (7%) or went to landfill (31%) 2011 - p37 of https://www.gov.uk/government/uploads/system/uploads/attachment_data/file/401400/Digest_of_waste_England_2015_-_final.pdf
14% clothes waste recycled - p37 of https://www.gov.uk/government/uploads/system/uploads/attachment_data/file/401400/Digest_of_waste_England_2015_-_final.pdf
48% clothes waste reused (14% overseas / 34% UK) - p37 of https://www.gov.uk/government/uploads/system/uploads/attachment_data/file/401400/Digest_of_waste_England_2015_-_final.pdf
wood pie chart-
use statistics on what recycled wood is used for and make pie chart accordingly :
p18 of https://www.gov.uk/government/uploads/system/uploads/attachment_data/file/82571/consult-wood-waste-researchreview-20120731.pdf (could title 'Where does it go?')
(numbers below in kilotons)
Panel board 1,119
Bedding 500
Equine 75
Mulches 150
Pathways 17
Biomass Energy 551
Informal Commercial 100
Informal Domestic 150
Exports 540
Total 3,202 (divide by 360 = 8.894)
therefore 1 degree = 8.894
so divide above tonnage by 8.894 to get angle...
pie chart angles:
Panel board 125.8
Bedding 56.2
Equine 8.4
Mulches 16.9
Pathways 1.9
Biomass Energy 62
Informal Commercial 11.2
Informal Domestic 16.9
Exports 60.7
Total 360
wood waste arising from sectors:
p8 of https://www.gov.uk/government/uploads/system/uploads/attachment_data/file/82571/consult-wood-waste-researchreview-20120731.pdf
Construction 1.2 - 93.9
Demolition/Remodelling 1.1 - 86.1
Furniture 0.3 - 23.5
Joinery 0.1 - 7.8
Other Industrial 0.1 - 7.8
Municipal 0.6 - 47
Packaging 1.2 - 93.9
Total 4.6 - 360
360 / 4.6 = 78.26
therefore multiply by 78.26
computers -
before:
1,231,078.853 tonnes EEE placed on market in 2014 - from EEE spreadsheet on https://www.gov.uk/government/statistics/waste-electrical-and-electronic-equipment-in-the-uk-2013
1231078.853 + 488188.186 = 1,719,267 tonnes EEE placed on market 2014
manufacture alone of Iphone 5s in 2013 produced 23.6 mil tonnes of emissions.
http://therestartproject.org/consumption/energy-and-our-gadgets/
iphone 5s produces 70kg c02 emissions (81% of which at production)
therefore 56.7kg emissions per iphone 5s production.
UK spent 4.97 billion pounds on electronics in 2013 - http://www.statista.com/statistics/274833/consumer-electronics-ce-revenue-in-the-united-kingdom-uk/
toxic chemicals - http://www.greenpeace.org/international/Global/international/planet-2/report/2007/10/laptopreport2.pdf
after:
Nearly 25% of waste electrical and electronic equipment (WEEE) that’s taken to household waste recycling centres could be re-used, worth around £200m gross a year : http://www.wrap.org.uk/content/facts-and-figures
include facts about illicit recycling in ghana etc. - health issues.
207,222 tonnes of carbon equivalent were saved in 2012 in UK by recycling weee
p 73
landfill decomposition : http://recycling.about.com/od/Resources/fl/How-Long-Does-It-Take-Garbage-to-Decompose.htm
titanium - http://www.bbc.com/future/story/20140105-timeline-of-the-far-future
paper/glass/plastic - look at knowledge is beautiful p20
general household waste recycling stats (household waste is basically everything except commercial waste, explained p5-6) -
https://www.gov.uk/government/uploads/system/uploads/attachment_data/file/375945/Statistics_Notice_Nov_2014_Final__3_.pdf - page 5
defra waste stats:
https://www.gov.uk/government/uploads/system/uploads/attachment_data/file/401400/Digest_of_waste_England_2015_-_final.pdf
p23 - packaging waste by material
composition of biodegradable/recyclable landfill waste - p30
composition of local authority collected waste - p34 (unclear if landfill or recycled or overall)
composition of dry recycling - p36
fate of clothing waste - p37
food waste - p38-41
manufacturing waste in price by sector - p55
gate fees for landfill waste streams (wood) - p63
emissions avoided by waste management (recycling etc.) - p73
general facts about recycling and waste management -
http://www.wasteconnect.co.uk/page.aspx?ID=57abb248-648f-4244-b93e-96baad9134fe
import costs statistics (by month) - https://www.uktradeinfo.com/Statistics/NonEUOverseasTrade/Pages/NonEuOTS.aspx
manufacturing sales uk by division 2012 -
http://www.ons.gov.uk/ons/rel/prodcom/prodcom-provisional-results/2012/sty-prod-2012.html
glass flow 2008 (probably not useful) (pdf download) -
http://www.google.co.uk/url?sa=t&rct=j&q=&esrc=s&source=web&cd=3&ved=0CC0QFjAC&url=http%3A%2F%2Fwww.britglass.org.uk%2Fpublications%2Fdownload%2Fuk-glass-manufacture-a-mass-balance-study-2008&ei=V7oiVab7CYLkUuCegoAG&usg=AFQjCNEGXh1vEyubaDGS1jclrayXMJDLHg&sig2=xaJMIqLhhHQJAkBGkW3nzA&bvm=bv.89947451,d.d24
glass flow (production etc) 2012 (wrap) -
http://www.wrap.org.uk/sites/files/wrap/GlassFlow%20Final%20Report.pdf
aluminium and steel import export production:
https://www.surrey.ac.uk/ces/files/pdf/0304_WP_Biffaward_Steel_Al-Final.pdf
eu production statistics data:
http://ec.europa.eu/eurostat/web/prodcom
textiles facts:
http://www.wrap.org.uk/content/fast-facts-textiles
decomposition time:
http://www.blueseaonline.net/manager/filemanager/files/2798-1The_Green_Space.pdf
http://begreenpackagingstore.com/pages/trash-time-decomposition (WITH SOURCES)
http://www.solcomhouse.com/recycling.htm
different types of plastic:
http://www.qualitylogoproducts.com/lib/different-types-of-plastic.htm
environmental agency data download
http://www.geostore.com/environment-agency/WebStore?xml=environment-agency/xml/ogcDataDownload.xml#:
local environmental data (could look at leeds?)
https://www.gov.uk/check-local-environmental-data
computer waste general stats:
http://www.wasteconnect.co.uk/page.aspx?ID=50a1245d-dec9-47eb-8e52-9534478b6c92
http://www.rwmexhibition.com/files/prof_margaret_bates__university_of_northampton.pdf
carbon savings caused by recycling (by material) - p 73 of https://www.gov.uk/government/uploads/system/uploads/attachment_data/file/422618/Digest_of_waste_England_-_finalv2.pdf
weee information:
http://ban.org/E-waste/technotrashfinalcomp.pdf
other weee info: http://www.360environmental.co.uk/legislation/producer_responsibility/weee_regulations/#exports
global paper and board statistics:
http://www.paper.org.uk/members/statistics/papermaking/eukey/CEPI_KeyStatistics_2013.pdf
packaging waste exported + other
http://npwd.environment-agency.gov.uk/Public/PublicSummaryData.aspx
general wood stats:
http://www.forestry.gov.uk/forestry/infd-9mbhsd
could make into book / calendar / website?
have slogan at bottom?
"some of this isn't as confusing as you think"
"these are the facts, try to understand why"
"these are the facts, what can be done to make the situation better?"
decomposition rates : http://www.cleanhouston.org/living/recycling/decomposition.htm
Evaluation :
Overall, I am quite pleased with the outcome of the design publication. Given the late date at which it was started and the extent to which it confused me for much of the year, I feel as though the outcome I have reached was relatively clear and straightforward.
Having said that, the quality of the design could have been more thorough. It would have been good to have more illustrative diagrams, as well as simply more content. Despite that, the content that was there was presented clearly, and hopefullly the message will be understood by the examiner.
Having reviewed the process and outcome of my design publication, I can say that I am relatively pleased with the relationship between the two. Due to the short turnaround time for the production of the publication, many of the design decisions were taken during the production process and were informed by the content and layout. While this allows for an easy readability of the book, it is hardly a professional method, and prevents a deeper understanding of the content from being communicated to the audience.
If I were to do the brief again in the future I would definitely plan it more, and start designing far earlier. By evaluating my process on the subject brief (in this case informative waste) as it was carried out, I would have been able to gain a deeper understanding of the process, which in turn would inform the design of the publication, enriching it and clarifying for myself and the reader. These actions would also have the further benefit of increasing my understandingof the subject brief as I was doing it, which would most likely lead to better results.
I would also use a singular hole puncher nest time, rather than trying to line it all up by eye with a standard one! While this worked out all right in the end, it took longer than it could have done, and was fairly stressful.


